Final Report
A leakage‑safe, time‑aware pipeline that forecasts daily sales per store.
Executive Summary
- Model: XGBoost tuned with Optuna on a chronological split.
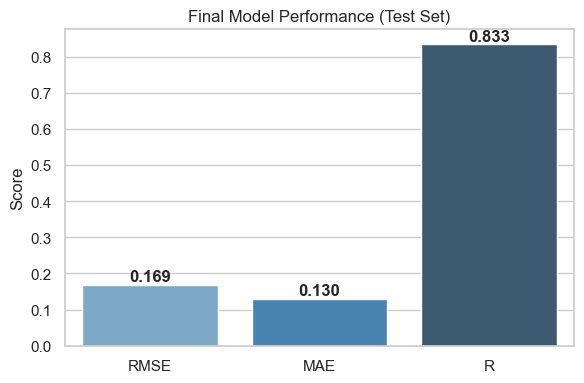
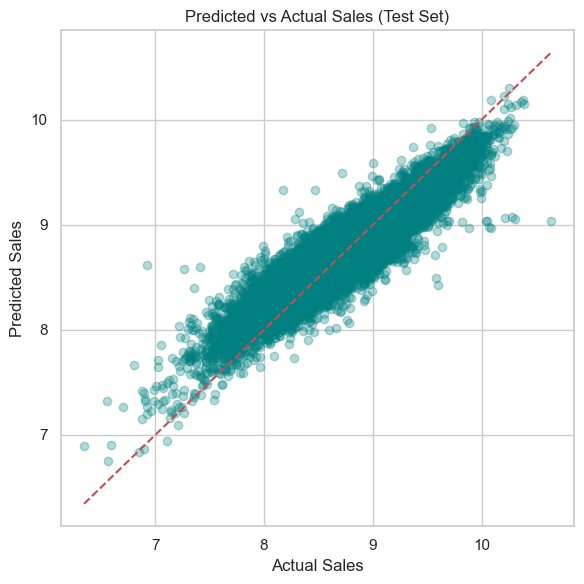
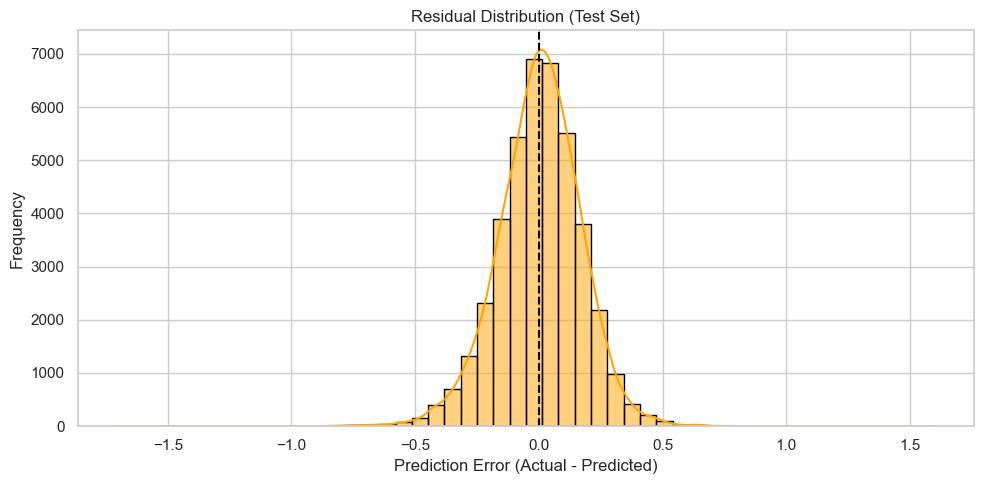
- Test results (log scale): RMSE 0.169, MAE 0.130, R² 0.833.
- Data coverage: 2013‑01‑01 to 2015‑07‑31; 844,338 open‑store rows; 1,115 stores.
- Main drivers: Promotions, competition distance, weekday and store effects.
1. Problem & Approach
- Business need: reliable daily forecasts for staffing and inventory at the store level.
- Predict log1p(Sales) per store to stabilize variance.
- Use a time‑aware split with the last six weeks as test to mirror real deployment and prevent leakage.
2. Data & Features
- Built from
train.csvjoined withstore.csv. Keep open days only. RemoveCustomersat training and inference time. - Key transforms:
log1p(Sales),log1p(CompetitionDistance), one‑hot for low‑cardinality categoricals, calendar parts (year, month, week, weekday, weekend). - Useful engineered signals: a leakage‑safe Store_AvgSales (computed only on the training window), a small set of promo × store/assortment interactions, and ActiveStoreCount for daily coverage.
3. Key EDA Findings
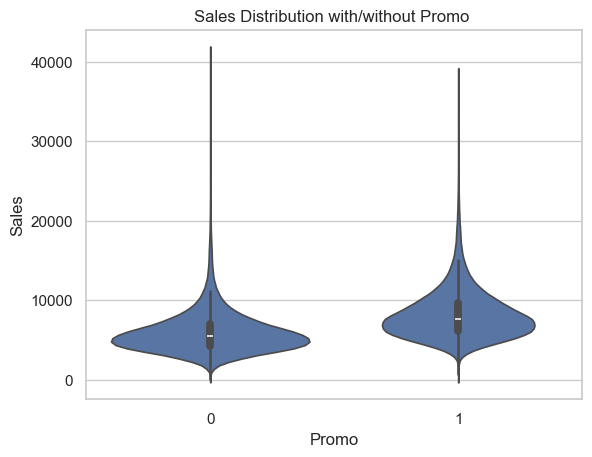
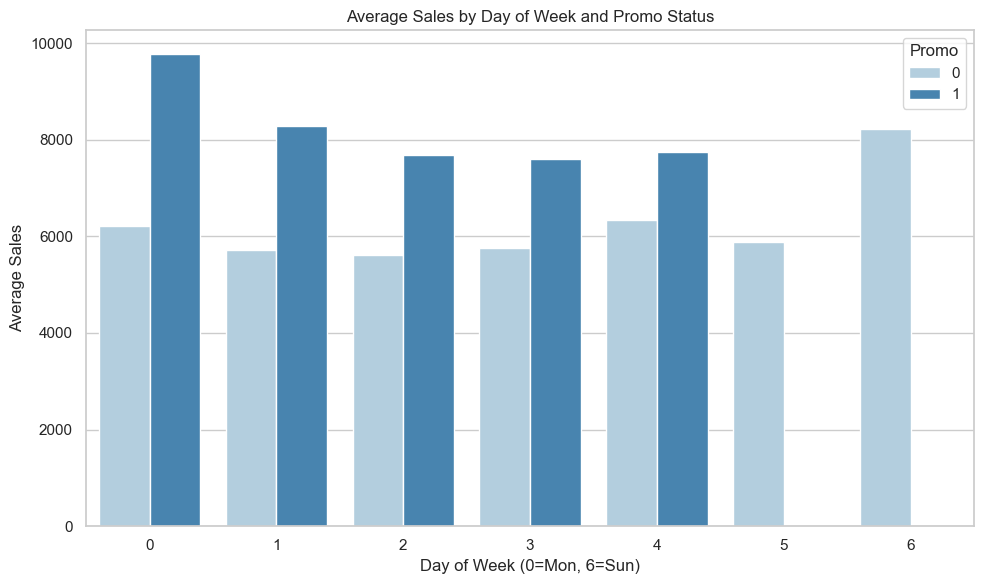
- Promotions work. Promo days shift the sales distribution higher and lift means.
- Promo2 underperforms. Stores flagged with Promo2 trail non‑Promo2 stores on average.
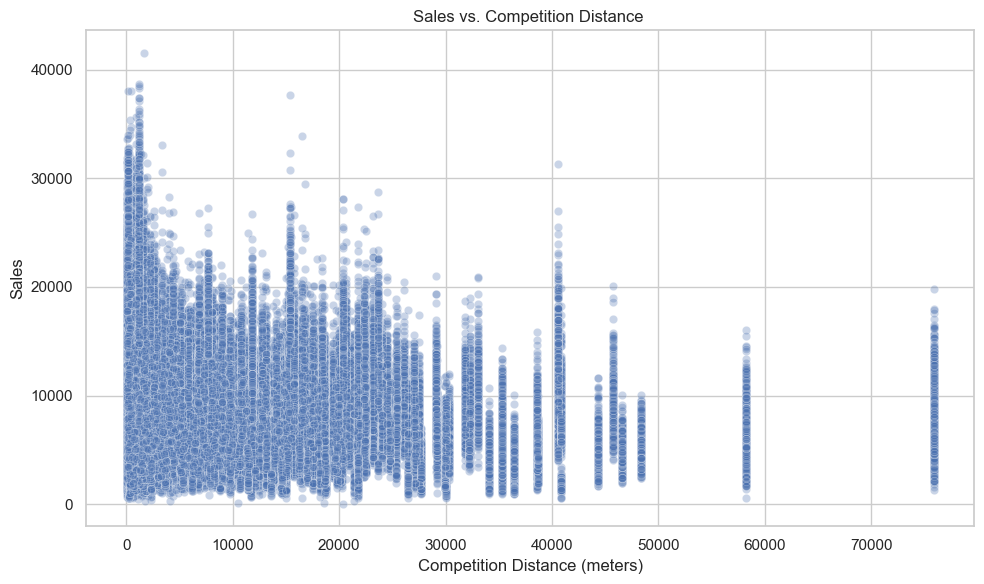
- Competition proximity often helps. Shorter distances correlate with higher sales, consistent with dense retail zones.
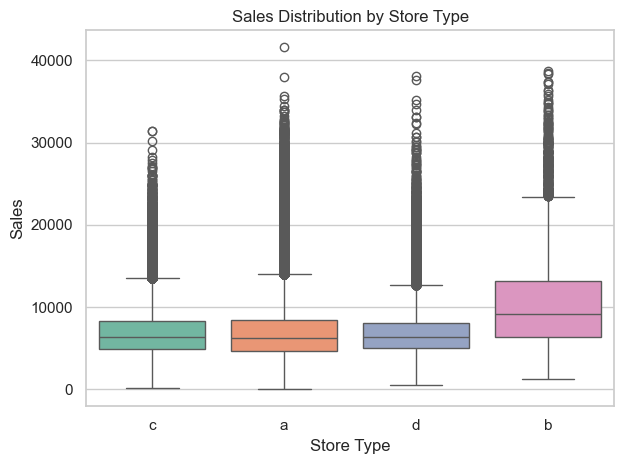
- Store heterogeneity matters. Type b stores are high‑performing but more volatile; others are steadier.
- School holidays show a measurable effect; state holidays mostly imply closures and were dropped.
4. Validation & Modeling
- Split: final six weeks (2015‑06‑19 → 2015‑07‑31) as test; earlier period for train/validation; no date overlap.
- Retrained on train+val and evaluated once on the holdout.
- Result: RMSE 0.169, MAE 0.130, R² 0.833 on the log scale.
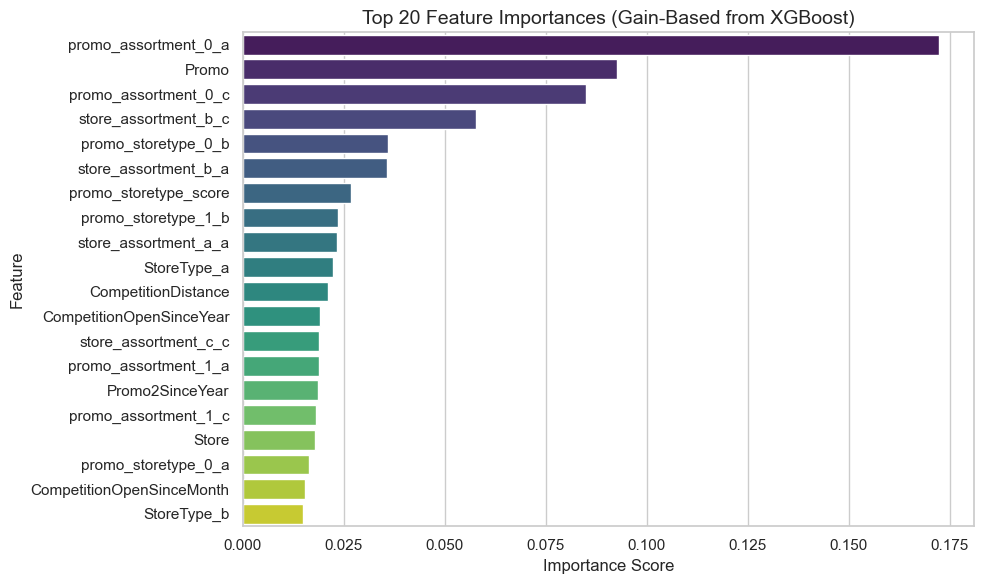
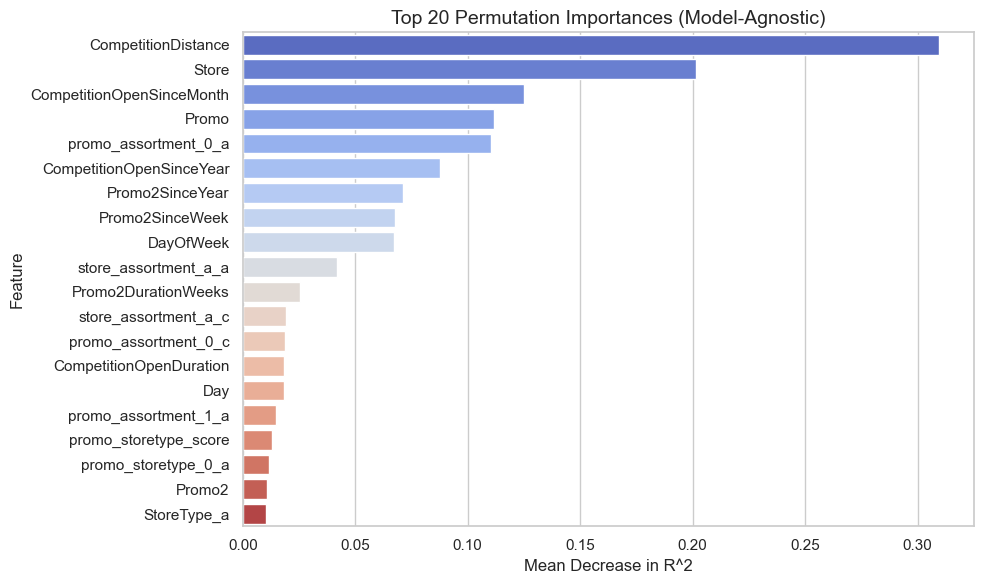
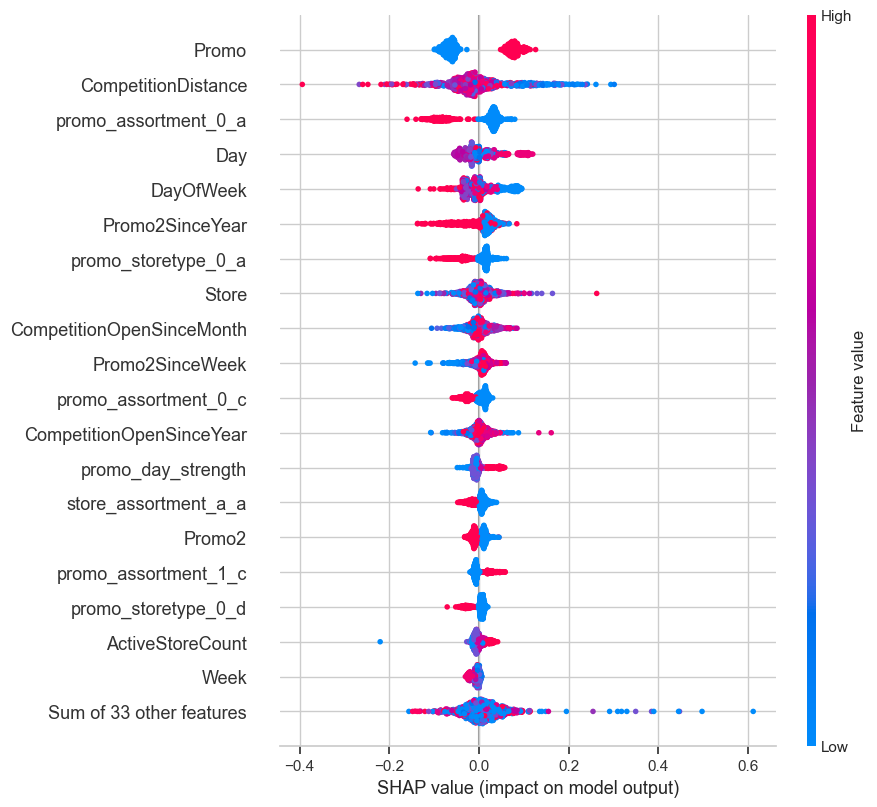
5. What Drives the Forecast
- Promotions are the strongest, most consistent signal across importance, permutation, and SHAP.
- Competition distance ranks among the top drivers; closer stores often see higher predicted sales.
- Calendar/store effects (weekday and store baselines) provide steady lift.
6. Implications
- Promo planning: plan staffing and inventory around proven promo uplift; measure by store and weekday. Treat Promo2 cautiously.
- Operations: accuracy is strong enough for schedule and inventory planning; add a buffer for peak days.
- Location signal: near‑competitor stores can thrive; proximity often proxies for foot traffic.
7. Next Steps
- Add prediction intervals so planners see a range, not just a point.
- Automate a nightly batch run that writes store‑day forecasts to CSV for the dashboard.
- Set a simple retraining cadence (for example, quarterly) and monitor a few basic checks like promo mix and competition distance.
- Create a lightweight dashboard to compare forecasts vs. actuals by store and day.
Justin Castillo · Email: jcastillo.hotels@gmail.com | GitHub: justin-castillo | LinkedIn: linkedin.com/in/justin-castillo-69351198