This notebook provides our first look into the Twitter US Airline Sentiment dataset (≈ 14 600 tweets, February 2015) and generates two baseline visualizations that will inform subsequent data‑preparation and modeling work.
Objectives
Load the raw CSV file into a pandas DataFrame.
Summarize overall sentiment distribution.
Compare sentiment across individual airlines.
Record key observations to guide the modeling plan.
Reason for negative sentiment (NaN for neutral/positive)
negativereason_confidence
float64
Model confidence for negativereason
airline
object
Airline name (American, Delta, United, …)
airline_sentiment_gold
object
Gold‑standard label (very sparse)
name
object
Twitter handle of the author
negativereason_gold
object
Gold‑standard negative reason (very sparse)
retweet_count
int64
How many times the tweet was retweeted
text
object
Full tweet text
tweet_coord
object
GPS coordinates if provided
tweet_created
object
UTC timestamp string
tweet_location
object
User‑provided location
user_timezone
object
User‐reported timezone
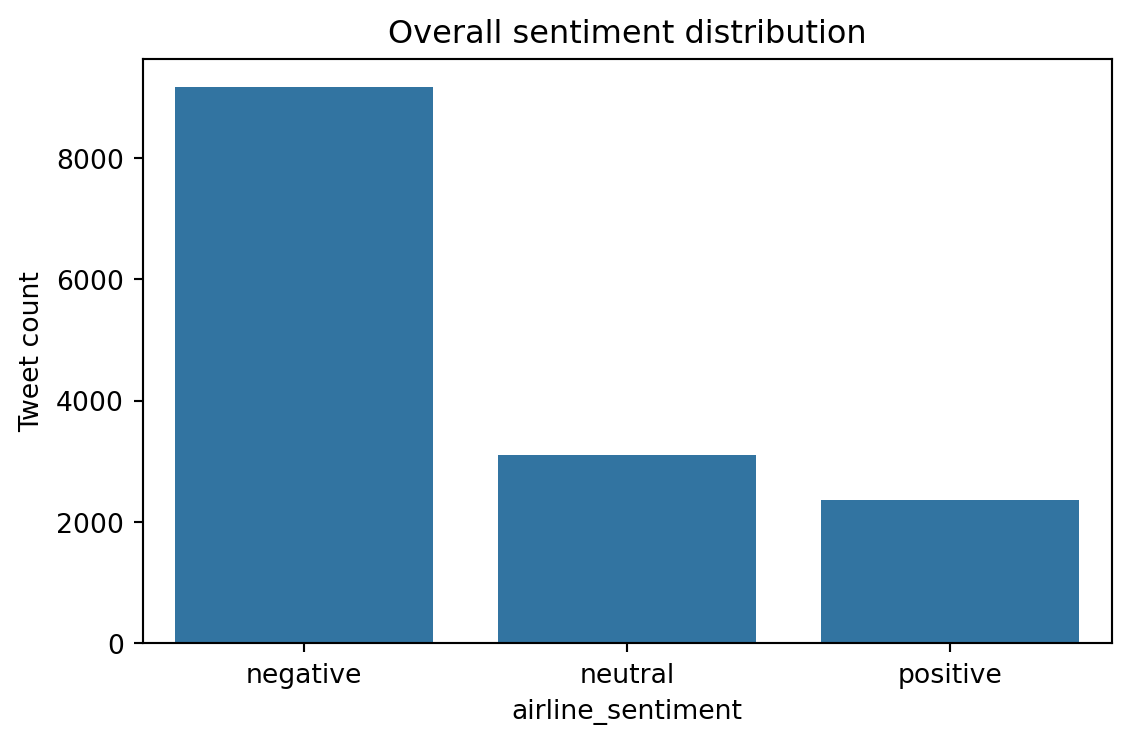
3. Sentiment Distribution
The bar chart below illustrates the overall class balance (9 178 negative, 3 099 neutral, 2 363 positive).
The figure is saved to reports/fig_sentiment_distribution.png.
The dataset is imbalanced: 62.7 % negative, 21.2 % neutral, and 16.1 % positive. Implication: stratified splits and class weighting will be required to avoid biased models.
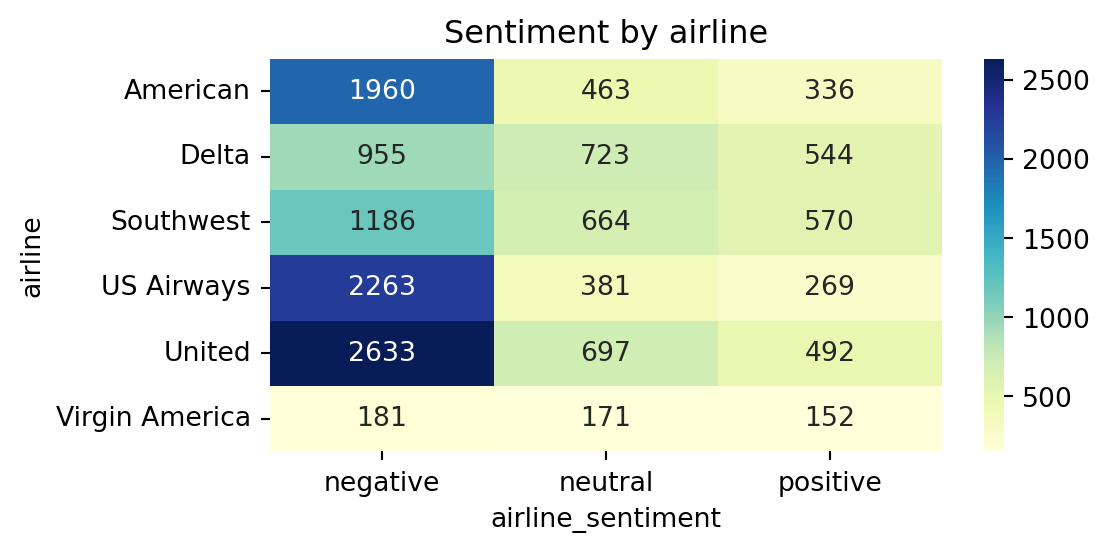
United and US Airways receive the highest volumes of negative tweets (2 633 and 2 263 respectively).
American also attracts many complaints, whereas Southwest shows a comparatively higher share of positive tweets.
Text preprocessing must address URLs, mentions, casing, and lemmatization before vectorization.
The negativereason column is populated for ~9 000 rows; it may enable multi‑task learning or error‑analysis later.