Exploratory Data Analysis


Notebook Outline

  1. Data & Imports
  2. Class Balance
  3. Tweet-Length Distributions
  4. Negative-Reason Breakdown
  5. Sentiment by Airline
  6. Quick TF-IDF Peek — Top Terms by Sentiment
  7. Key Insights

1. Data & Imports


Load the pre‑processed dataset data/processed/tweets.parquet and perform a quick shape / null check.

  • 14 640 rows × 5 columns after preprocessing — matches raw count (no data loss).
  • Columns: tweet_id, airline, airline_sentiment, clean_text, negativereason
  • No unexpected nulls (aside from negativereason, which is naturally sparse).
Code
# Imports 
from pathlib import Path

import pandas as pd
import seaborn as sns
import matplotlib.pyplot as plt
from IPython.display import display
from sklearn.feature_extraction.text import TfidfVectorizer

PROJ_ROOT  = Path.cwd().parent              
FIG_DIR    = PROJ_ROOT / "reports" / "figs_eda"
DATA_PATH  = PROJ_ROOT / "data" / "processed" / "tweets.parquet"

FIG_DIR.mkdir(parents=True, exist_ok=True)

df = pd.read_parquet(DATA_PATH)

print(f"Loaded {len(df):,} rows × {df.shape[1]} columns")
display(df.head())
Loaded 14,640 rows × 5 columns
tweet_id airline airline_sentiment clean_text negativereason
0 570306133677760513 Virgin America neutral what said. None
1 570301130888122368 Virgin America positive plus you've added commercials to the experienc... None
2 570301083672813571 Virgin America neutral i didn't today... must mean i need to take ano... None
3 570301031407624196 Virgin America negative it's really aggressive to blast obnoxious "ent... Bad Flight
4 570300817074462722 Virgin America negative and it's a really big bad thing about it Can't Tell

2. Class Balance


The dataset is strongly imbalanced – negative tweets dominate.

Sentiment Share
Negative 63 %
Neutral 21 %
Positive 16 %
  • Implication → apply stratified sampling and class weighting / resampling for any supervised model.
Code
sent_dist = df["airline_sentiment"].value_counts(normalize=True)
sns.barplot(x=sent_dist.index, y=sent_dist.values)
plt.title("Class balance (share)")
plt.ylabel("Proportion")
plt.tight_layout()
plt.savefig("../reports/figs_eda/class_balance.png", dpi=150)

3. Tweet‑Length Distributions


Two views of tweet length after cleaning.

Metric Median IQR 95th pct
Characters 108 74 – 129 167
Words 17 11 – 22 29
  • Character distribution is left‑skewed but bounded < 180; word counts top out near 35.
  • Padding/truncation guideline → 160 chars or 30 words captures > 99 % of tweets.
Code
df["char_len"]  = df["clean_text"].str.len()
df["word_count"] = df["clean_text"].str.split().str.len()

fig, axes = plt.subplots(1, 2, figsize=(10, 3))
sns.histplot(df["char_len"], ax=axes[0], bins=40)
axes[0].set_title("Tweet length (char)")
sns.histplot(df["word_count"], ax=axes[1], bins=40)
axes[1].set_title("Tweet length (words)")
plt.tight_layout()
plt.savefig("../reports/figs_eda/length_distributions.png", dpi=150)

4. Negative‑Reason Breakdown


Top complaint categories among negative tweets.

Rank Reason Count Share
 1 Customer Service Issue ~3 000 33 %
 2 Late Flight ~1 600 18 %
 3 Can’t Tell / N/A ~1 300 13 %
 4 Cancelled Flight ~1 000 11 %
 5 Lost Luggage    800   9 %
  • Customer‑service complaints dominate—consider a dedicated topic model or sentiment sub‑label.
  • Tail reasons (< 3 %) can be merged or dropped to prevent feature sparsity.
Code
neg_counts = (df[df["airline_sentiment"] == "negative"]
              .value_counts("negativereason")
              .sort_values())
neg_counts.plot(kind="barh", figsize=(6,4))
plt.title("Negative reasons")
plt.tight_layout()
plt.savefig("../reports/figs_eda/negative_reasons.png", dpi=150)

5. Sentiment by Airline


Two complementary views:

  • Stacked 100 % bar → distribution of sentiments per airline.
  • Diverging barPositive % − Negative % (“net gap”).
Airline Net gap Insight
US Airways ‑0.66 Most negative overall
American ‑0.55 Similar to US Airways
United ‑0.50 High negative volume
Southwest ‑0.23 Moderately better perception
Delta ‑0.17 Best among majors
Virgin America ‑0.03 Nearly sentiment‑neutral
  • Virgin America enjoys the highest positive share (~ 34 %).
  • Consider adding airline as a categorical feature or training airline‑specific models.
Code
# prepare data
sent_prop = (
    df.pivot_table(index="airline",
                   columns="airline_sentiment",
                   values="tweet_id",
                   aggfunc="count",
                   fill_value=0)
      .pipe(lambda t: t.div(t.sum(axis=1), axis=0))               # row %
      [["negative", "neutral", "positive"]]                       # order
)
gap = (sent_prop["positive"] - sent_prop["negative"]).sort_values()

# plot combined figure 
palette = ["#d62728", "#ffbf00", "#2ca02c"]

fig, axes = plt.subplots(
    1, 2, figsize=(10, 3), gridspec_kw={"wspace": 0.35}, constrained_layout=True
)

# left: stacked 100 %
sent_prop.plot(kind="bar", stacked=True, width=0.8,
               color=palette, ax=axes[0])
axes[0].set_ylabel("Proportion")
axes[0].set_xlabel("")
axes[0].set_title("Sentiment share by airline")
axes[0].legend(title="", loc="upper left", bbox_to_anchor=(1.04, 1))

# right: diverging bar
sns.barplot(x=gap.values, y=gap.index, ax=axes[1])
for bar, v in zip(axes[1].patches, gap.values):
    bar.set_facecolor("#d62728" if v < 0 else "#2ca02c")
axes[1].set_xlabel("Positive % – Negative %")
axes[1].set_ylabel("")
axes[1].axvline(0, color="k", lw=0.8)
axes[1].set_title("Net sentiment gap")

display(fig)
plt.close(fig) 

fig.savefig(FIG_DIR / "sentiment_share_and_gap.png", dpi=150)

# individual images
for name, f in [("sentiment_share_by_airline.png", sent_prop),
                ("net_sentiment_gap.png", gap)]:
    plt.figure(figsize=(4,3))
    if name.startswith("sentiment"):
        f.plot(kind="bar", stacked=True, width=0.8, color=palette, legend=False)
    else:
        sns.barplot(x=f.values, y=f.index)
        for bar, v in zip(plt.gca().patches, f.values):
            bar.set_facecolor("#d62728" if v < 0 else "#2ca02c")
        plt.axvline(0, color="k", lw=0.8)
    plt.tight_layout()
    plt.savefig(FIG_DIR / name, dpi=150)
    plt.close()

<Figure size 384x288 with 0 Axes>

6. Quick TF‑IDF Peek — Top Terms by Sentiment


Negative Neutral Positive
flight flight thanks
cancelled thanks thank
service dm flight
hours fleek great
customer fleet love
  • Negative tweets emphasise disruption words “cancelled”, “service”, “hours”.
  • Positive tweets dominated by gratitude “thanks”, “love”, “great”.
  • Confirms that the cleaning pipeline retained sentiment‑bearing tokens and removed noise.
Code
# build separate corpora per sentiment
corpora = {
    sentiment: df.loc[df["airline_sentiment"] == sentiment, "clean_text"].tolist()
    for sentiment in ["negative", "neutral", "positive"]
}

# fit TF-IDF and grab top 10 terms for each 
vectorizer = TfidfVectorizer(
    stop_words="english",
    max_features=5_000,
    ngram_range=(1, 2),
)

top_terms = {}
for sentiment, texts in corpora.items():
    tfidf_matrix = vectorizer.fit_transform(texts)
    # average tf-idf per term & get top 10 indices
    avg_scores = tfidf_matrix.mean(axis=0).A1
    top_idx = avg_scores.argsort()[::-1][:10]
    top_terms[sentiment] = [vectorizer.get_feature_names_out()[i] for i in top_idx]

# show as a DataFrame 
top_df = pd.DataFrame(top_terms)
display(top_df)

# save to CSV
top_df.to_csv(FIG_DIR / "top_tfidf_terms.csv", index=False)
negative neutral positive
0 flight flight thanks
1 cancelled thanks thank
2 service dm flight
3 hours fleek great
4 customer fleet just
5 just fleet fleek love
6 hold just service
7 help flights best
8 time help good
9 plane need awesome

7. Key Insights


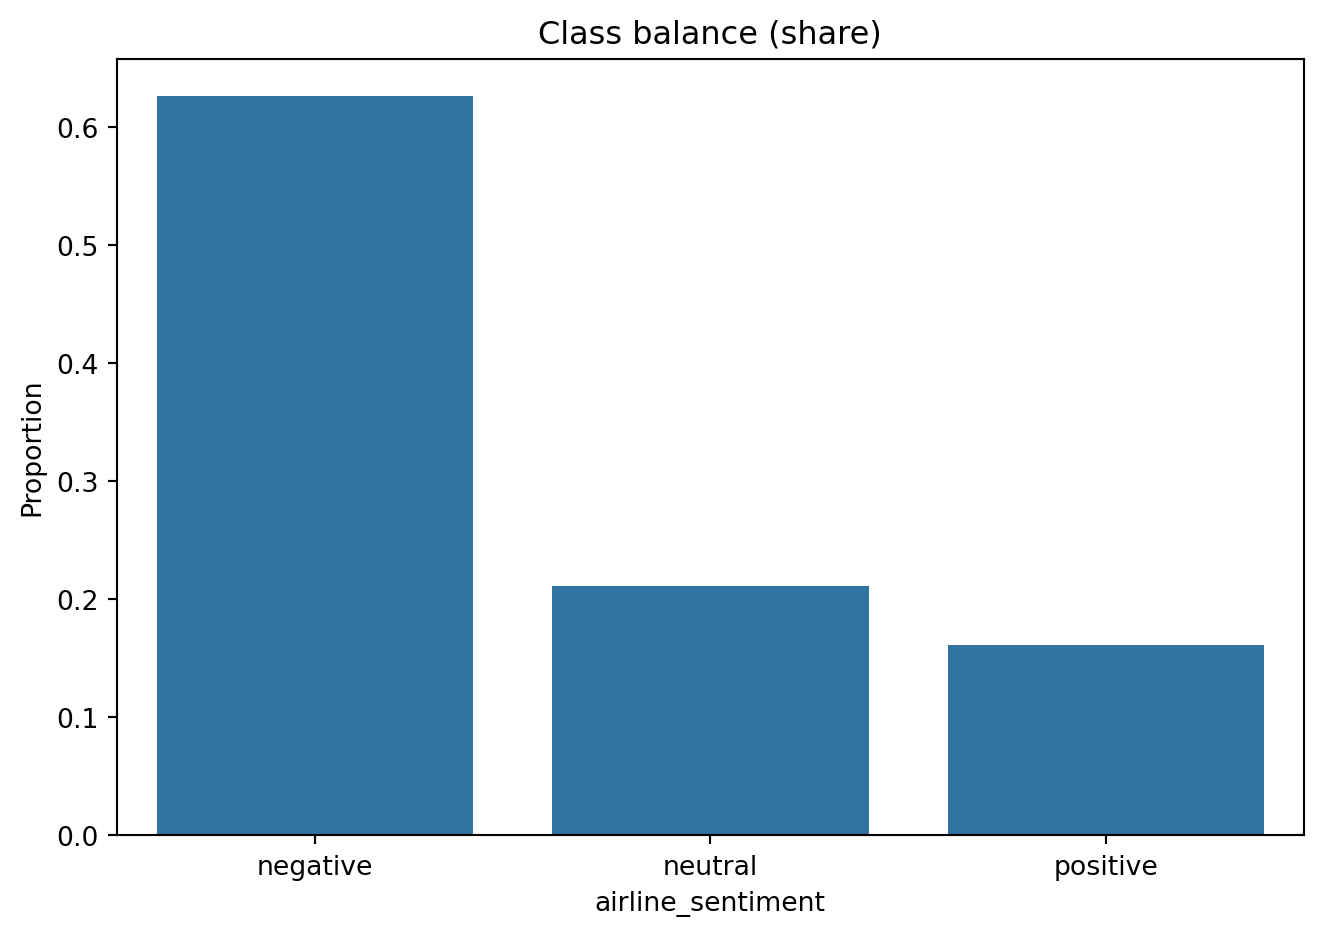
  • Label imbalance (63 % negative) demands stratified splits and weighting.
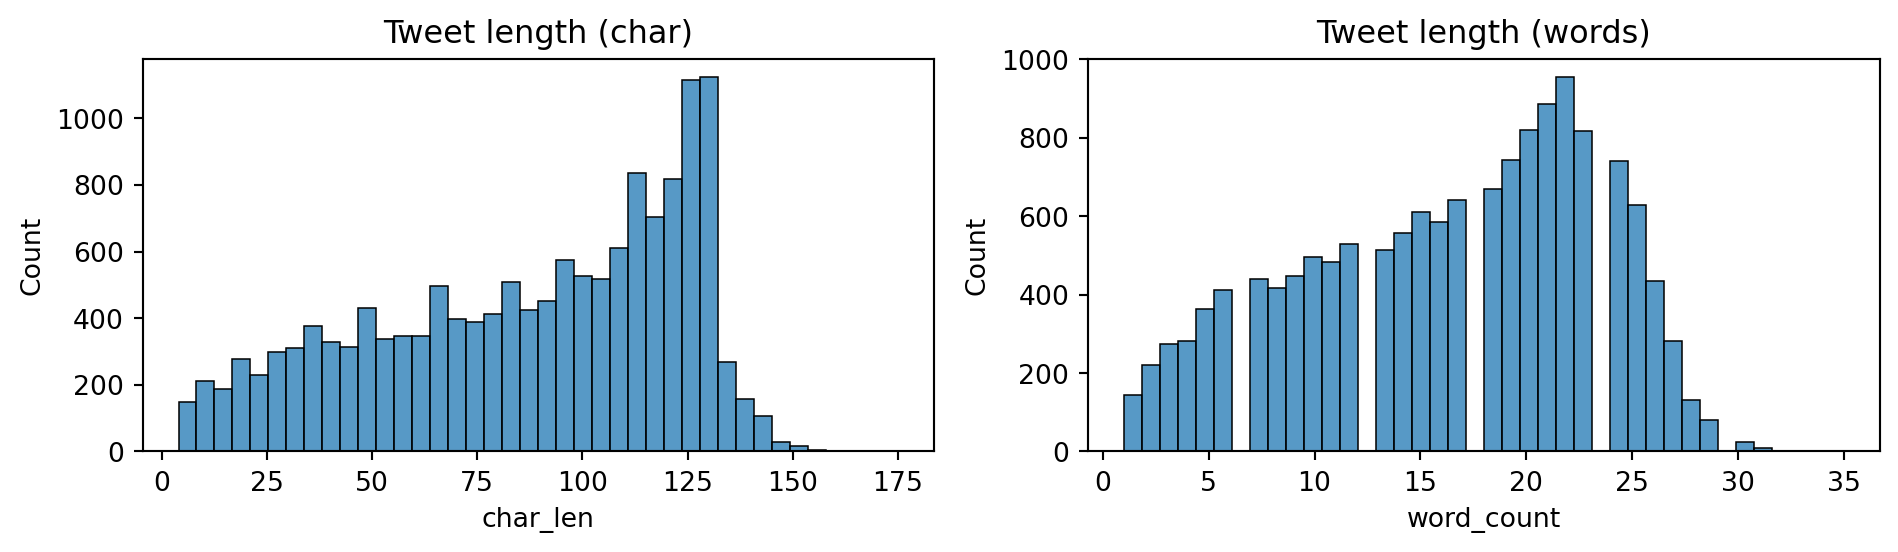
  • Typical tweet length ≈ 110 chars / 17 words → standard tokenizer window is sufficient.
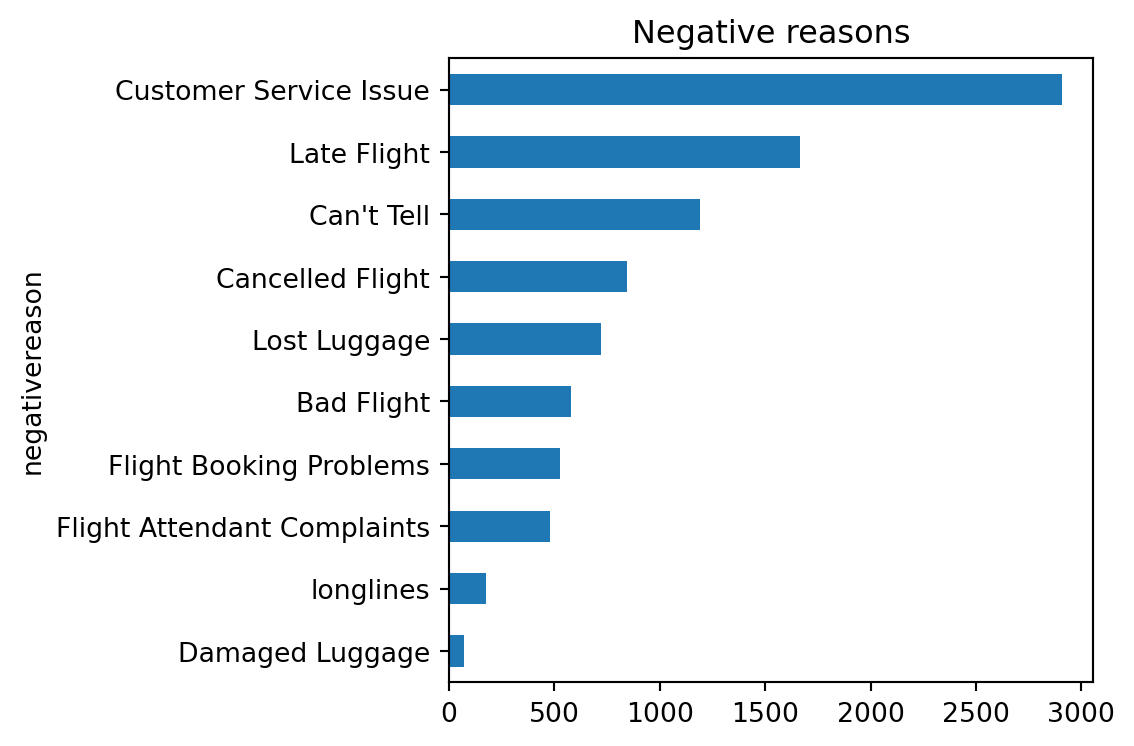
  • Customer‑service and late‑flight issues form > 50 % of negative reasons.
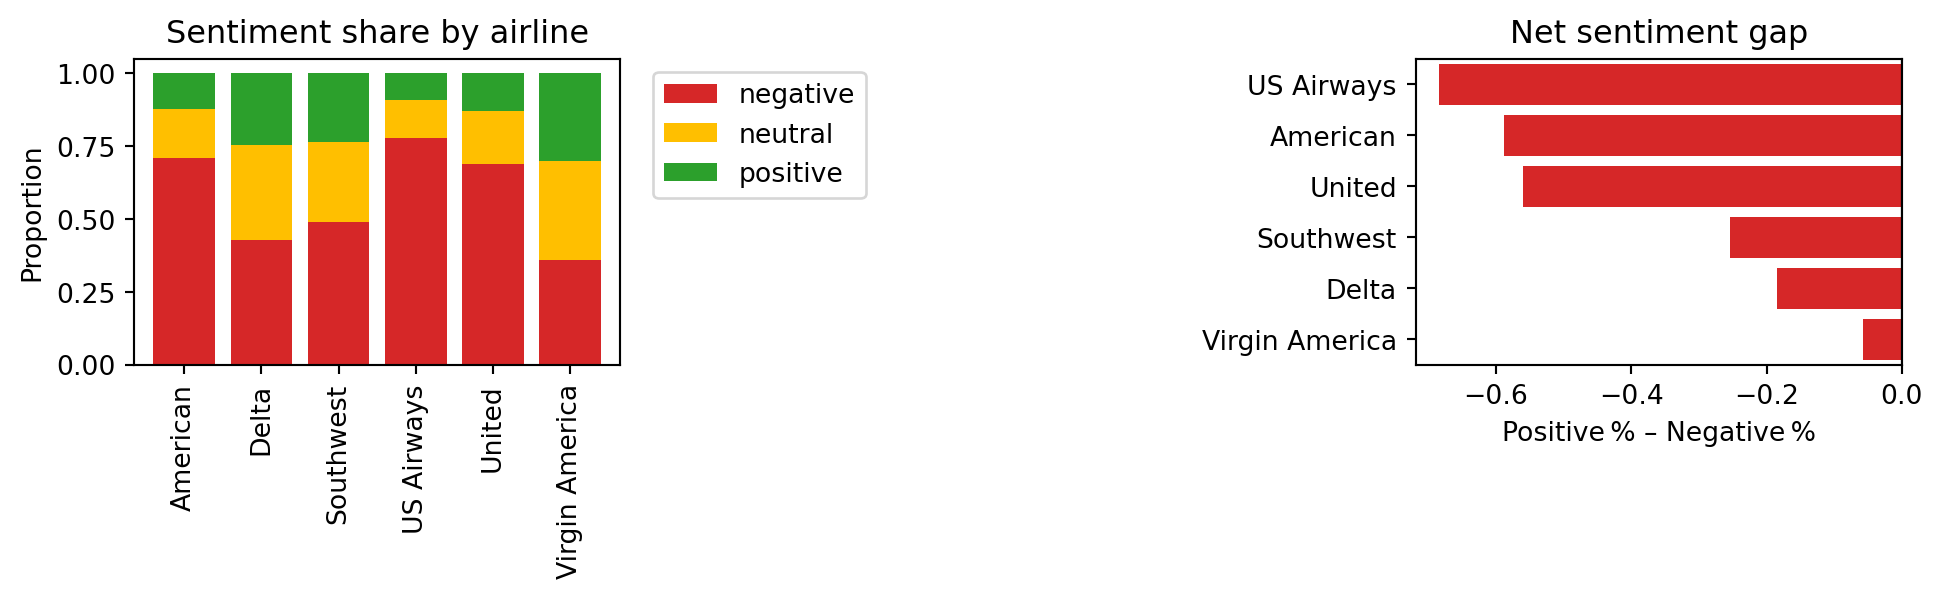
  • Virgin America and Southwest exhibit more positive sentiment → airline feature likely informative.

Next Steps

  1. Finalise feature list — text (TF‑IDF / embeddings) + metadata (airline, time, etc.).
  2. Select resampling or class‑weight strategy for modelling.
  3. Prototype baseline models in 04_baseline_model.ipynb